ASSIGNED TO YOUSenior Management Analytics Request
P1 · HIGH PRIORITY
DUEToday · 4:00 PM
Microsoft Teams · CEO Office“Need the numbers before the 4 PM review. Show me what is driving the problem — not just a chart.”
MZ ACADEMY // INTERACTIVE EXPERIENCE
ENTER THE ANALYST SEAT
Clean the data. Find the signal. Build the insight. Make the decision.
LIVE SIMULATION MISSION SELECT
ANALYST XP000 / 700
MISSION CLOCK00:00
STREAK0×
MZ DATA LAB // MISSION COMMAND CENTER
CHOOSE YOUR ANALYST MISSION
Four industries. Four datasets. One evolving analyst career.
CAREER LEVELTRAINEE0 / 4 MISSIONS
CERTIFICATION PROGRESS // 0%
SIMULATION MODEHints enabled · standard scoring
INCOMING BRIEF // RETAIL OPERATIONS
Revenue is falling. Management needs an answer.
You have been given a dirty order dataset from four Egyptian branches. Your job is to identify the weakest branch, explain the performance gap, and recommend an action.
ROWS1,000BRANCHES4ISSUES4
CEO_REQUEST.txt ● ● ●
> BUSINESS QUESTION

"Where are we losing performance,
and what should we do next?"

> DEADLINE: NOW
> CONFIDENCE REQUIRED: HIGH
SYSTEM Simulation initialized. Awaiting mission acceptance.
DATASET_01customer_orders.csv
QUALITY 61%
Order_ID
Branch
Channel
Revenue
Date
Resolve all four anomalies to unlock analysis.
VERSION 1.13.1 // 8-QUESTION ANALYSIS ASSIGNMENT
QUESTION 1 OF 8
Build the requested metric from the cleaned dataset.
0 / 8 COMPLETE
BUSINESS QUESTIONWhich branch generates the most revenue?
MODEL NOT BUILT
REPORT CANVAS // LIVE FROM CLEANED DATA0 clean rows
DRAG FIELDS TO BUILD THE ANALYSIS...
MANAGEMENT INTERPRETATION // SELECT ONE ANSWER
Complete all 8 requirements to unlock SQL.
PHASE 2 // SQL VALIDATION
Reproduce all 8 dashboard requirements in SQL.
Write and run a separate query for every KPI and chart. A single query is no longer enough.
0 / 8 QUERIES
KPI 01Select a task
Use the answer as a learning reference, then run it.
GUIDE ANSWER
CTRL + ENTER
Choose a requirement and write its SQL.
QUERY REQUESTRank branches from highest to lowest revenue.
NOT RUN
analysis.sqlresults
SQLUTF-8Ln 1
1
Ready
No query executed
Execute the query to inspect the cleaned data.
The result must reconcile with your analysis model before you can continue.
PHASE 3 // DASHBOARD BUILD
Build the complete management dashboard.
Drag the 4 KPI cards + 4 charts onto the report canvas. Choose each chart type before dragging it. All eight validated requirements must appear on the final dashboard.
0 / 8 VISUALS
Executive Performance DashboardPAGE 1 · 16:9 · LIVE MODEL
MZ BIREPORT BUILDERManagement View · cleaned model
MODEL CONNECTED
REPORT PAGE 1Executive Performance Analysis
X-AXIS / CATEGORYDROP A FIELD
Y-AXIS / VALUESDROP A FIELD
SUMMARIZATION
TOP RESULT—Build a visual
CLEAN ROWS—analysis source
GROUPS—categories
▥BUILD YOUR MANAGEMENT VISUALAssign an Axis and Value, then choose a visual.
INSIGHT ENGINEYour interpretation will appear after a valid visual is built.
FINAL DECISION
The CEO is waiting.
Which conclusion is best supported by your analysis?
DECISION ENGINE
Select the recommendation you would present to management.
MISSION COMPLETE // MZ DATA LAB
ANALYST PERFORMANCE REPORT
92/100
LEVEL: SENIOR ANALYST
DATA CLEANING 100ANALYSIS 91SQL THINKING 90BUSINESS DECISION 88
MISSION TELEMETRY // calculating performance...
MZ ACADEMY // DATA ANALYTICSI COMPLETED THE MZ DATA ANALYST CHALLENGE
Interactive portfolio experience by Mazin Nabil
● Connected to MZ-DB-PRODAutosave ONRole: Data AnalystEnvironment: Production Mirror
BIOMEDICAL ELECTROMAGNETICS / RESEARCH PAPER 01
ELECTROMAGNETIC DIAGNOSIS OF 1ST STAGE BREAST CANCER.
Microwave-based electromagnetic diagnosis research investigating how malignant tissue changes the electromagnetic response of a breast model for early-stage detection.
MICROWAVE DIAGNOSISCST STUDIO SUITEANTENNA ANALYSISBIOMEDICAL EM
EM SCANEARLY-STAGE TARGETMALIGNANT RESPONSE
SCROLL TO EXPLORE
01 / RESEARCH QUESTION
CAN AN ELECTROMAGNETIC SIGNAL REVEAL WHAT THE EYE CANNOT?
Malignant and healthy breast tissues exhibit different dielectric behavior. The research explores whether those contrasts can produce a measurable change in an antenna's electromagnetic response.
The engineering challenge is to build a controlled numerical environment in which the tissue model, excitation and resulting response can be compared systematically.
01BREAST PHANTOM
02EM EXCITATION
03TUMOR MODEL
04RESPONSE ANALYSIS
02 / DIAGNOSTIC WORKFLOW
FROM TISSUE MODEL TO MEASURABLE RESPONSE.
01
MODEL
Construct the breast phantom and define the anatomical tissue regions.
→02
MATERIALS
Assign dielectric properties representing the electromagnetic behavior of each tissue.
→03
EXCITE
Position the antenna and illuminate the model with the selected microwave signal.
→04
COMPARE
Evaluate healthy and malignant cases through S-parameters and field behavior.
03 / CST SIMULATION MODEL
MULTILAYER BREAST PHANTOM.
The simulation is organized as a layered biomedical electromagnetic model. Each region can be assigned its own material definition, allowing the malignant inclusion to be studied against surrounding healthy tissue.
Baseline antenna and field response of the tissue model.
VS
DIAGNOSTIC CASE
MALIGNANT TISSUE
Dielectric contrast perturbs the local field and measurable electromagnetic response.
05 / ANALYSIS SPACE
WHAT WE MEASURE.
S-PARAMETERS
Track changes in reflection behavior between reference and malignant models.
E-FIELD DISTRIBUTION
Visualize electromagnetic concentration and perturbation through the tissue volume.
TUMOR RESPONSE
Study the localized response associated with the malignant inclusion.
Portfolio visualization — numerical values and final plots can be replaced with the verified CST results from the research model.
06 / RESEARCH SIGNIFICANCE
ENGINEERING TOWARD EARLIER DETECTION.
By combining antenna engineering, tissue electromagnetics and full-wave simulation, the work investigates microwave sensing as a non-ionizing research approach for detecting dielectric abnormalities associated with early-stage breast cancer.
PUBLISHED RESEARCH · BIOMEDICAL ELECTROMAGNETICS · DMIP 2025
ELECTROMAGNETIC DIAGNOSIS OF FIRST STAGE BREAST CANCER
A compact rectangular spiral antenna was designed, fabricated and investigated as an electromagnetic sensor for early-stage breast-cancer diagnosis. The study tracks how malignant tissue changes the antenna's resonant response when the sensor is placed directly on a multilayer breast phantom.
ISM 2.4–2.5 GHzCST MICROWAVE STUDIOMATLAB ANALYSISVNA VALIDATIONS11 / RESONANCE SHIFT
REAL RESEARCH MODELHemisphere radius 75 mm · antenna mounted in direct contact
2.45GHz HEALTHY RESONANCE
3MHz STAGE IA SHIFT
0.585W/kg MAX 10g SAR
6TISSUE / TARGET MATERIALS
01
THE RESEARCH QUESTION
Can an antenna feel the difference?
Healthy and malignant breast tissues do not interact with electromagnetic fields in the same way. Their different dielectric properties alter the electromagnetic loading seen by an antenna placed on the breast. This work uses that change as the sensing mechanism: keep the antenna and phantom configuration controlled, introduce early-stage tumor scenarios, and observe the shift in resonance and impedance matching.
The goal is not to create an anatomical image from MRI data. There is no BrainWeb, 3D Slicer or MeshLab workflow here. The breast phantom is a purpose-built electromagnetic model, simulated in CST; MATLAB is used in the analysis workflow, and the fabricated antenna is validated experimentally with a Rohde & Schwarz ZVB20 Vector Network Analyzer.
SENSORPrinted rectangular spiral antennaDIAGNOSTIC FEATUREResonance-frequency shiftREFERENCEHealthy breast response
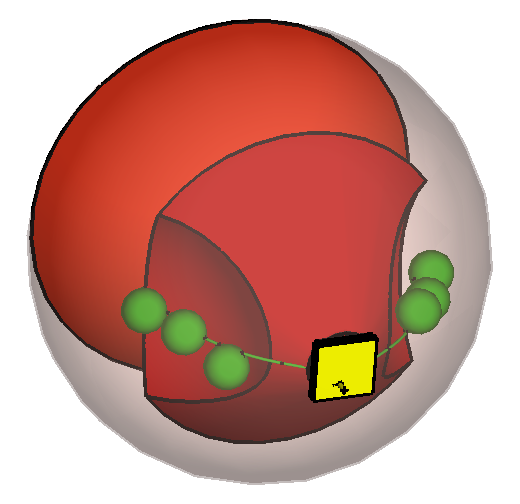
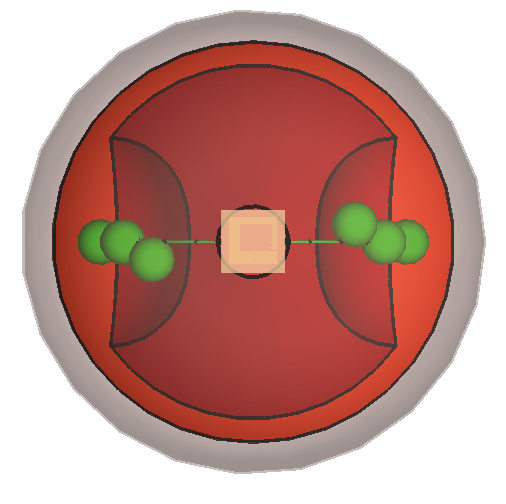
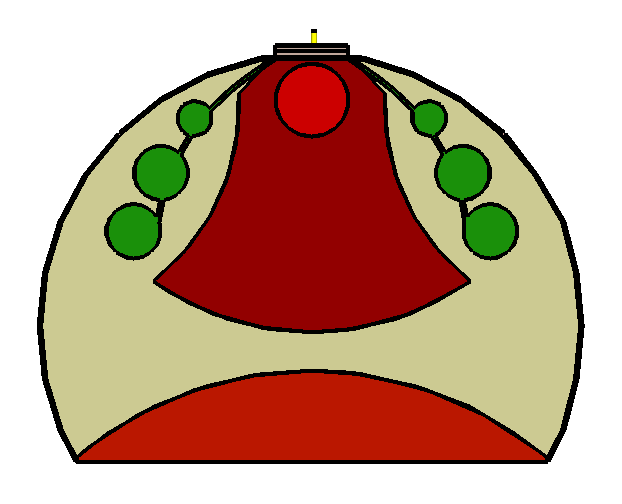
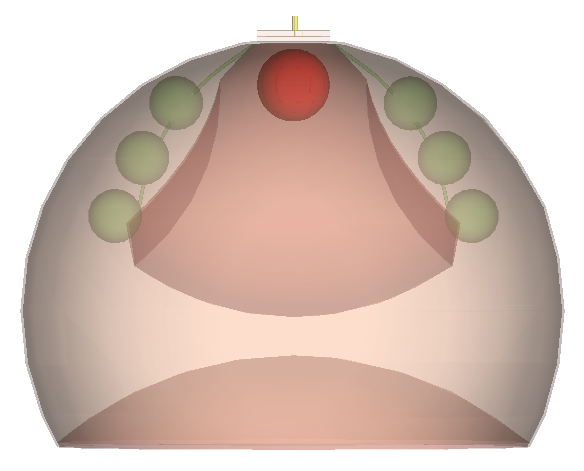
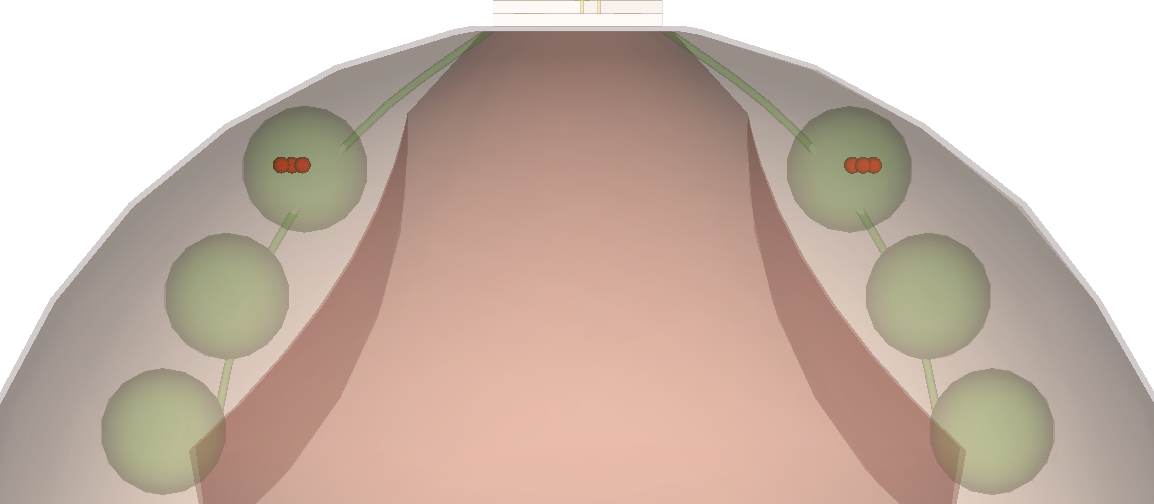
The phantom is a simplified hemispherical breast with a 75 mm radius. It includes skin, fat and muscle as the principal layers, while fibro-glandular tissue and lymph nodes are embedded inside the fat region. Three lymph nodes are modeled on each side of the fibro-glandular region, with ducts also represented. A flattened area at the nipple provides a repeatable mounting surface for the antenna.
This geometry allows the same sensor position to be maintained while tumor size and location are varied—so the resulting S11 changes can be compared against a healthy baseline.
LIVE MODEL VIEWElectromagnetic sensing concept
ALL TISSUESSelect a tissue above or click it directly on the model.
Fibro-glandularLymph nodesTumorSpiral sensor
Cross-sectional phantom architectureIsometric phantom with mounted antennaFront view and symmetric lymph-node placement
03
MATERIAL MODEL
Six electromagnetic material definitions.
The model explicitly separates tissue types by relative permittivity, conductivity and density. That contrast is fundamental to the sensing principle.
Tissue
εr
σ (S/m)
ρ (kg/m³)
Skin
37.9735
1.478
1100
Fat
5.14085
0.139
920
Fibro-glandular
57.2
1.99
1050
Muscle
52.668
1.773
1060
Lymph node
78
0.965
1050
Tumor
46.1
0.68
1050
04
FIRST-STAGE SCENARIOS
Stage IA to Stage IB: location matters.
Stage IA is represented by a single tumor in the fibro-glandular region. Stage IB extends the investigation to lymph-node involvement: 2, 4 and 6 lymph-node groups are tested, both with and without an additional fibro-glandular tumor. Each scenario is compared to the same healthy breast response.
Stage IA · cross-sectional viewStage IA · 3D modelStage IB · lymph-node groupsStage IB · groups with fibro-glandular tumor
05
FROM SIMULATION TO HARDWARE
Designed. Fabricated. Measured.
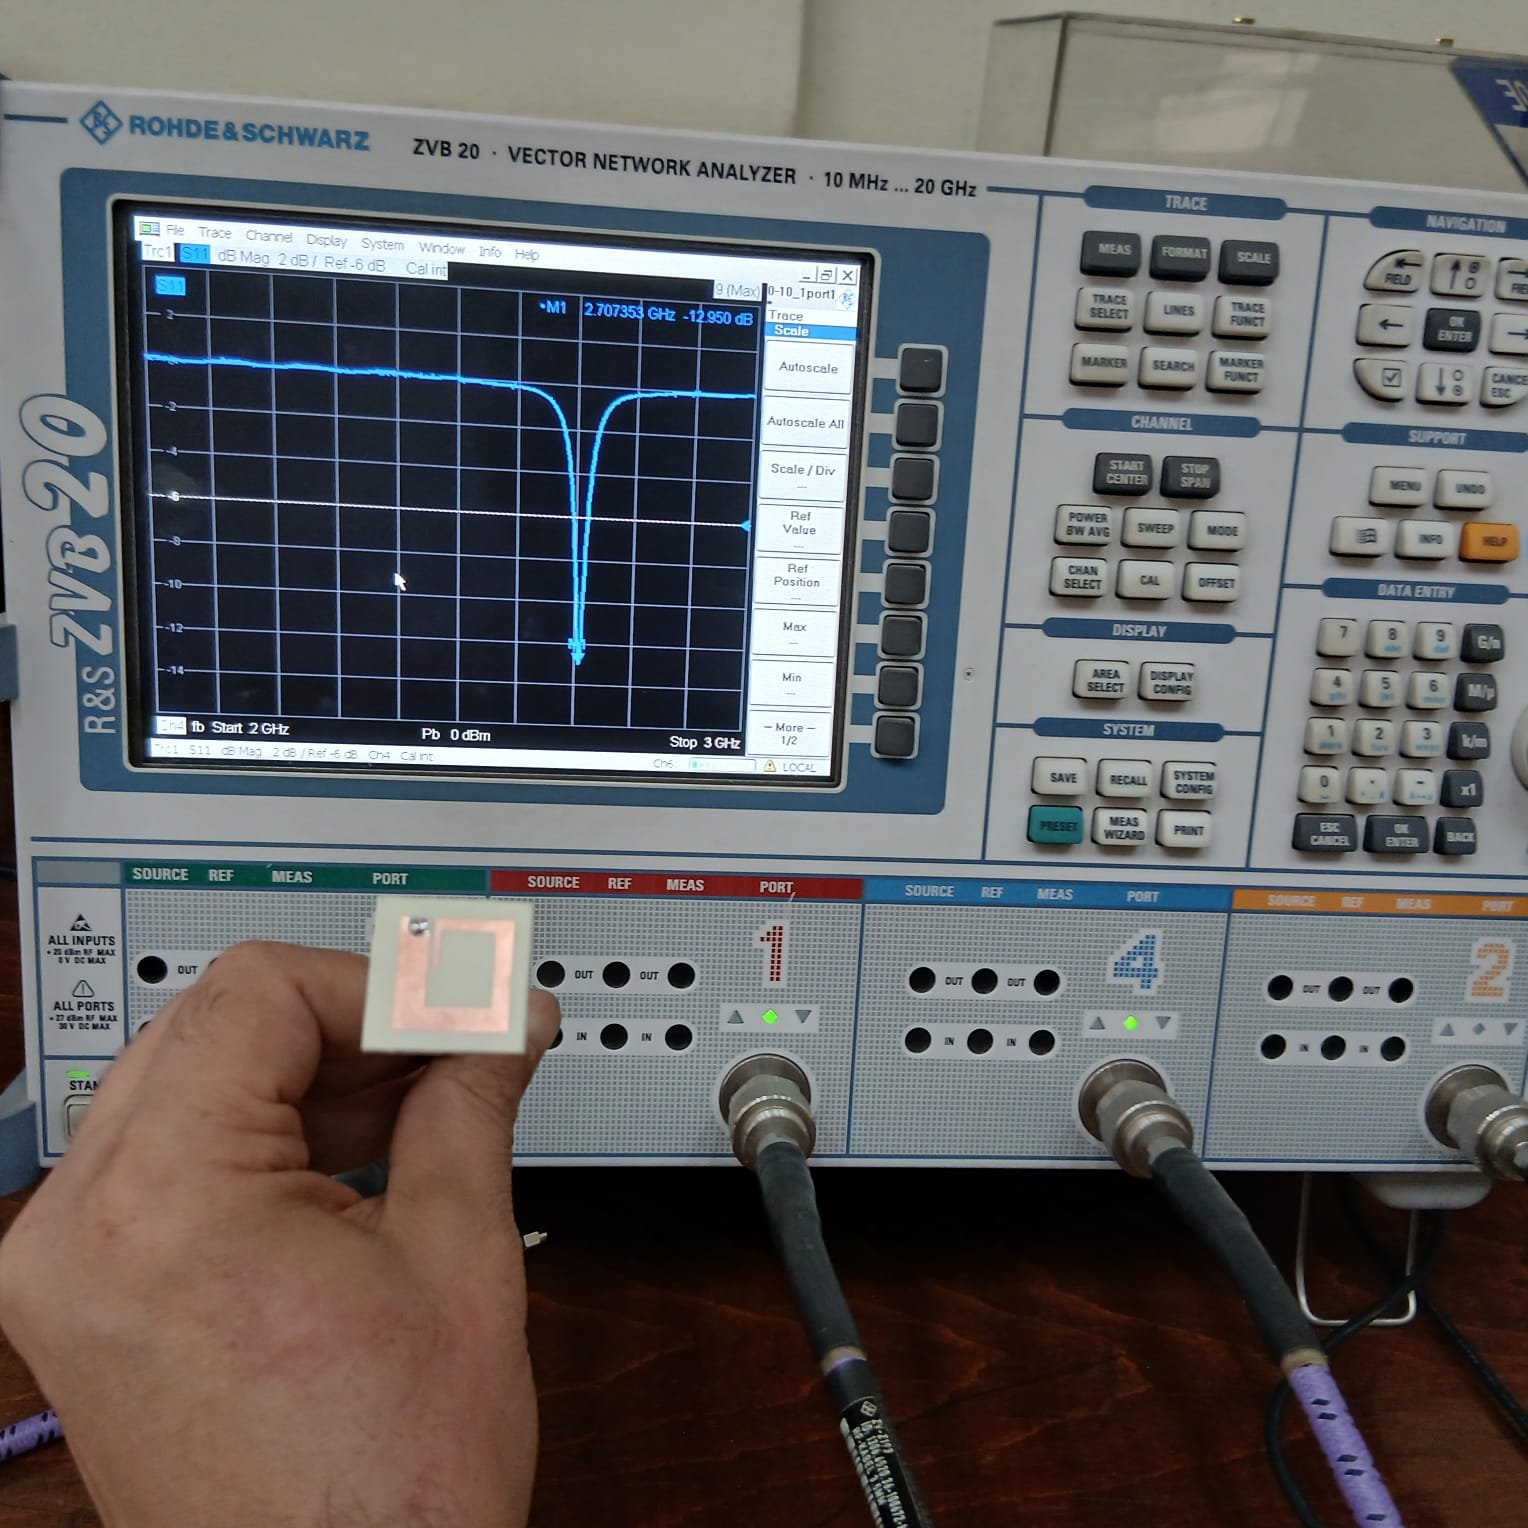
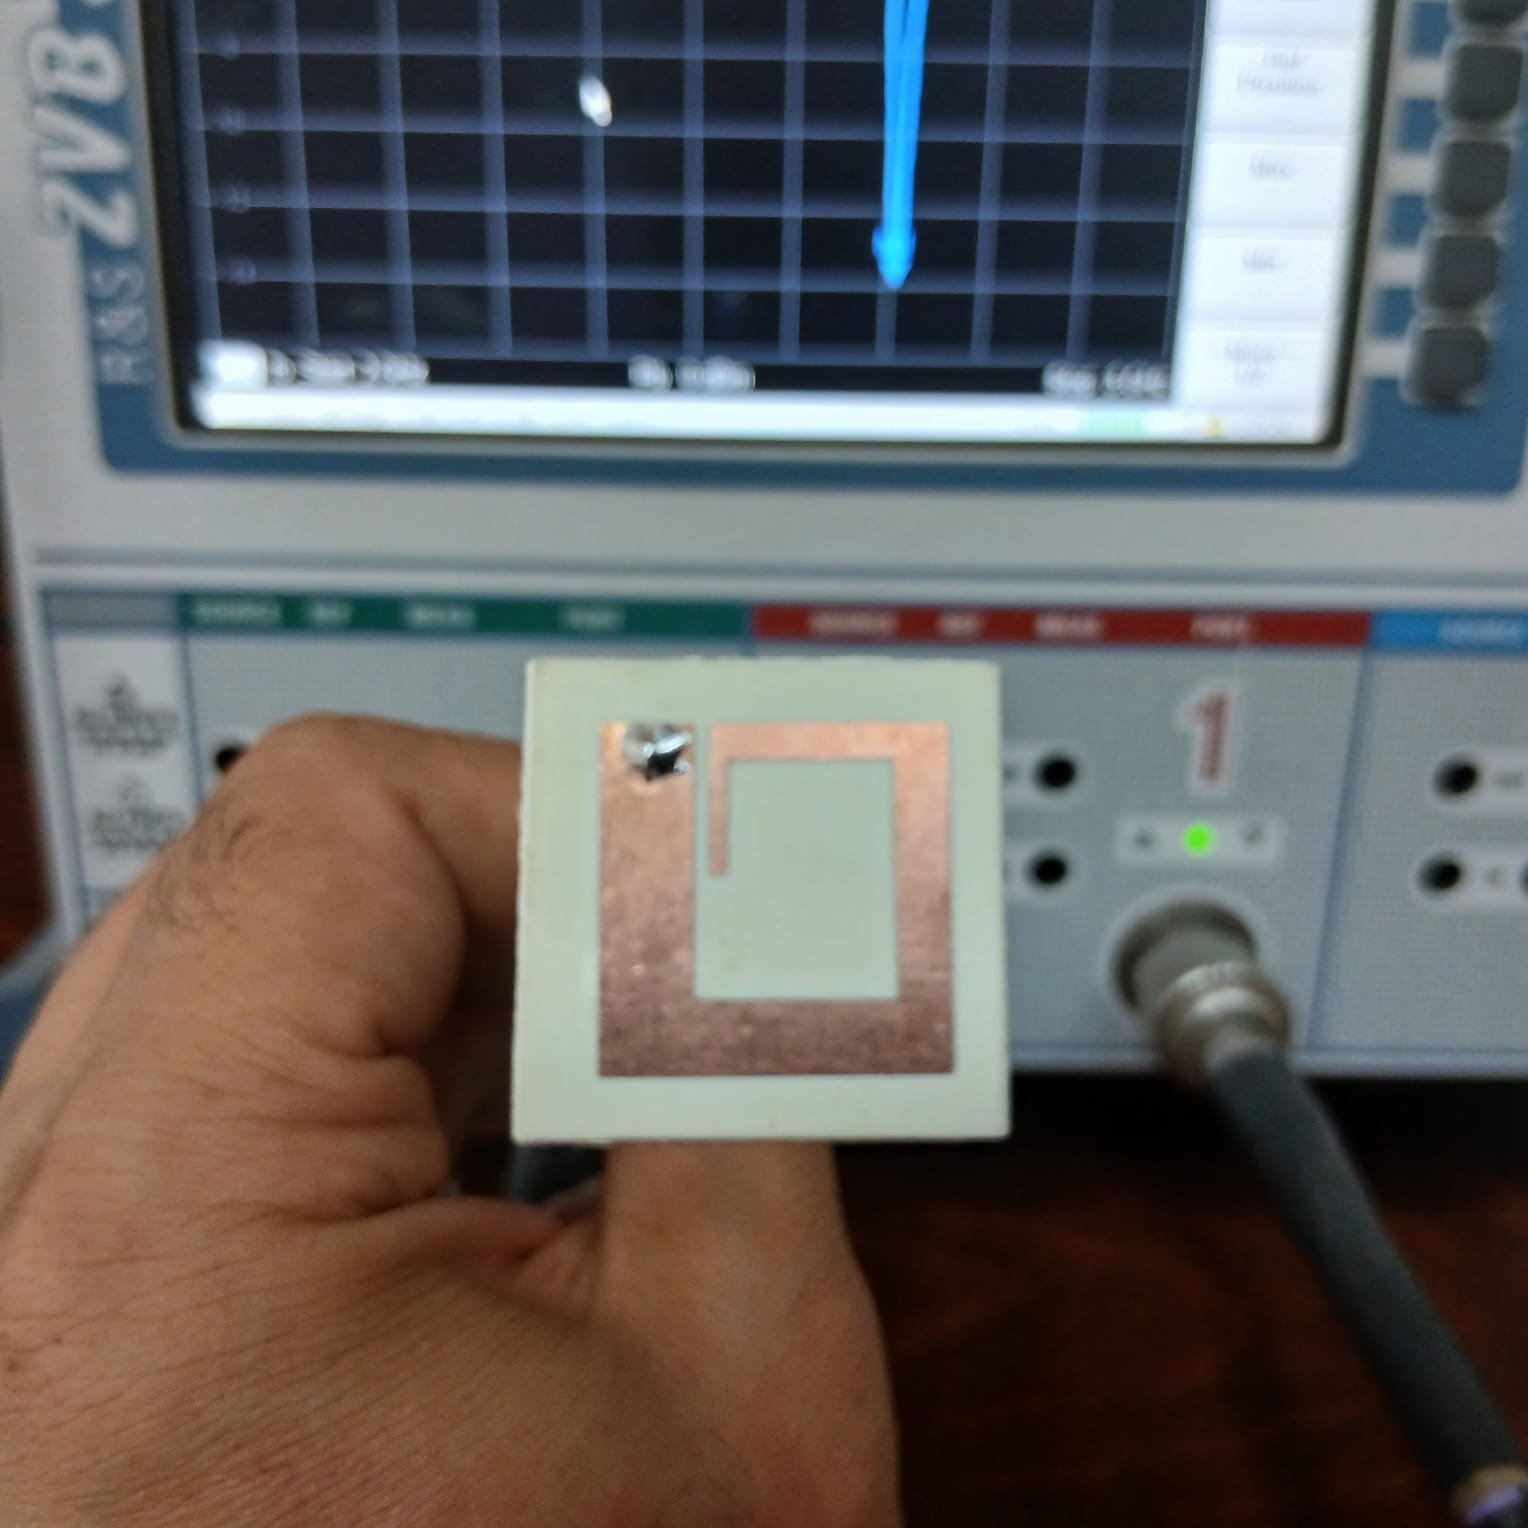
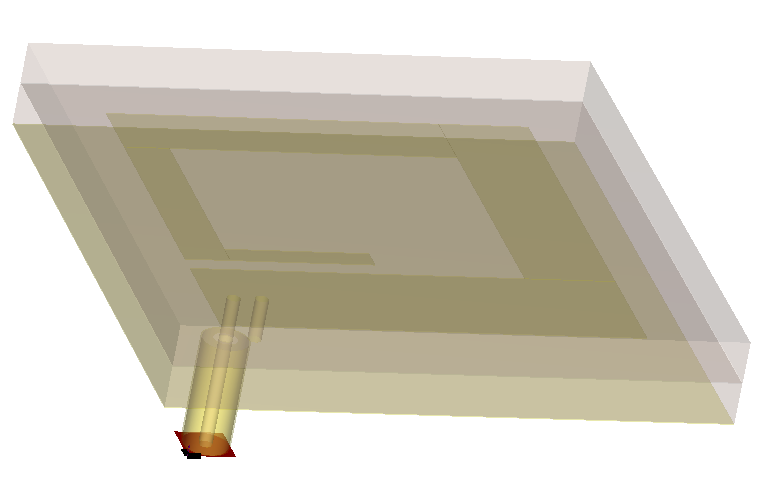
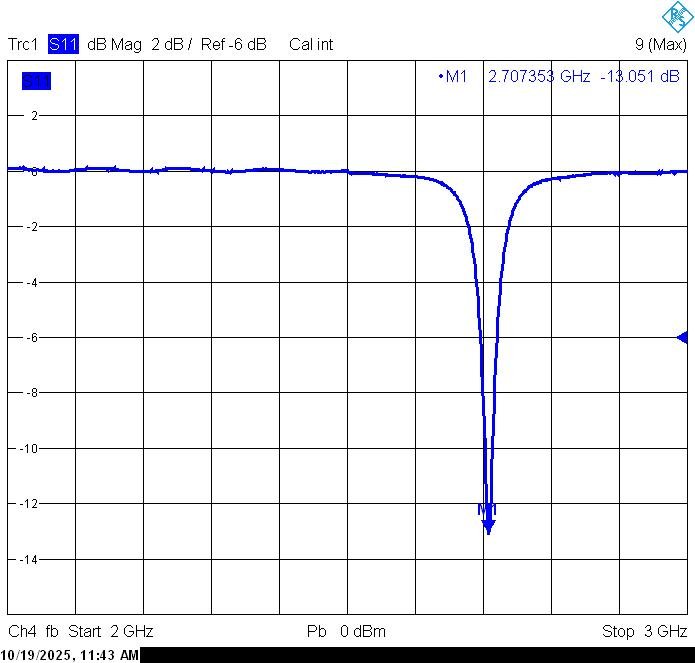
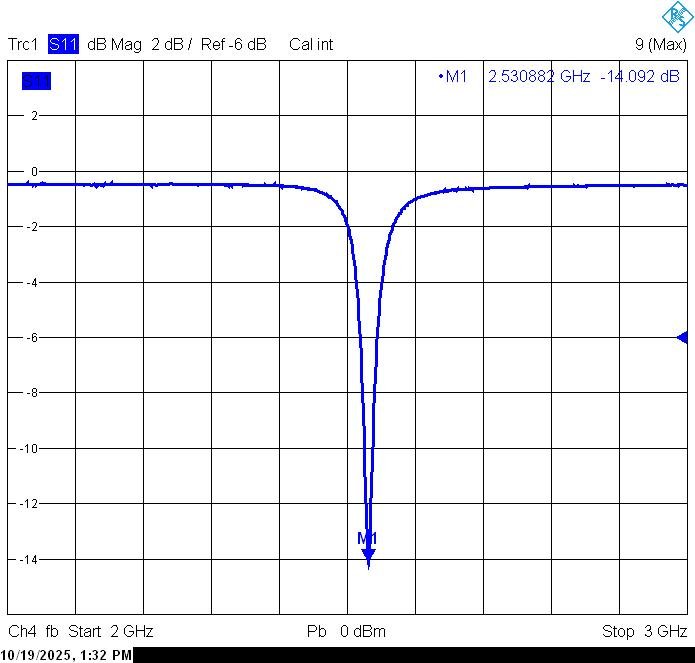
The sensor is not only a simulation. The rectangular spiral antenna was physically fabricated and characterized using a Rohde & Schwarz ZVB20 Vector Network Analyzer. The antenna uses annealed copper on Rogers 4350B, with a matching superstrate for protection and stability, and a 50 Ω coaxial feed.
The design targets the 2.4–2.5 GHz ISM band. Measurement provides a reality check against the simulated antenna response before the sensor is used as the diagnostic element in the breast-phantom study.
Fabricated spiral sensor in front of the ZVB20 VNAExposed copper spiral geometrySensor with protective superstrateExperimental S11 measurement
06
ANTENNA ENGINEERING
Compact geometry for biomedical sensing.
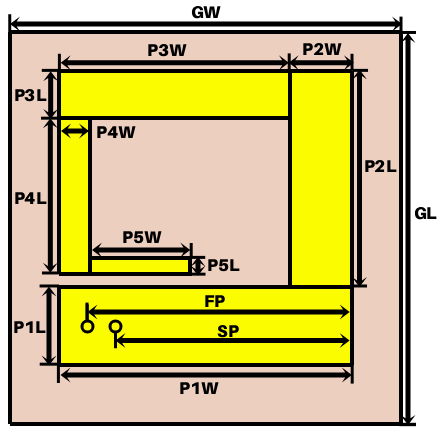
The planar spiral was selected for compact size and straightforward fabrication. In air, the design is optimized for good impedance matching in the ISM band. When mounted on the breast, the arm length and feed/shorting positions are retuned to compensate for the strong dielectric loading of tissue.
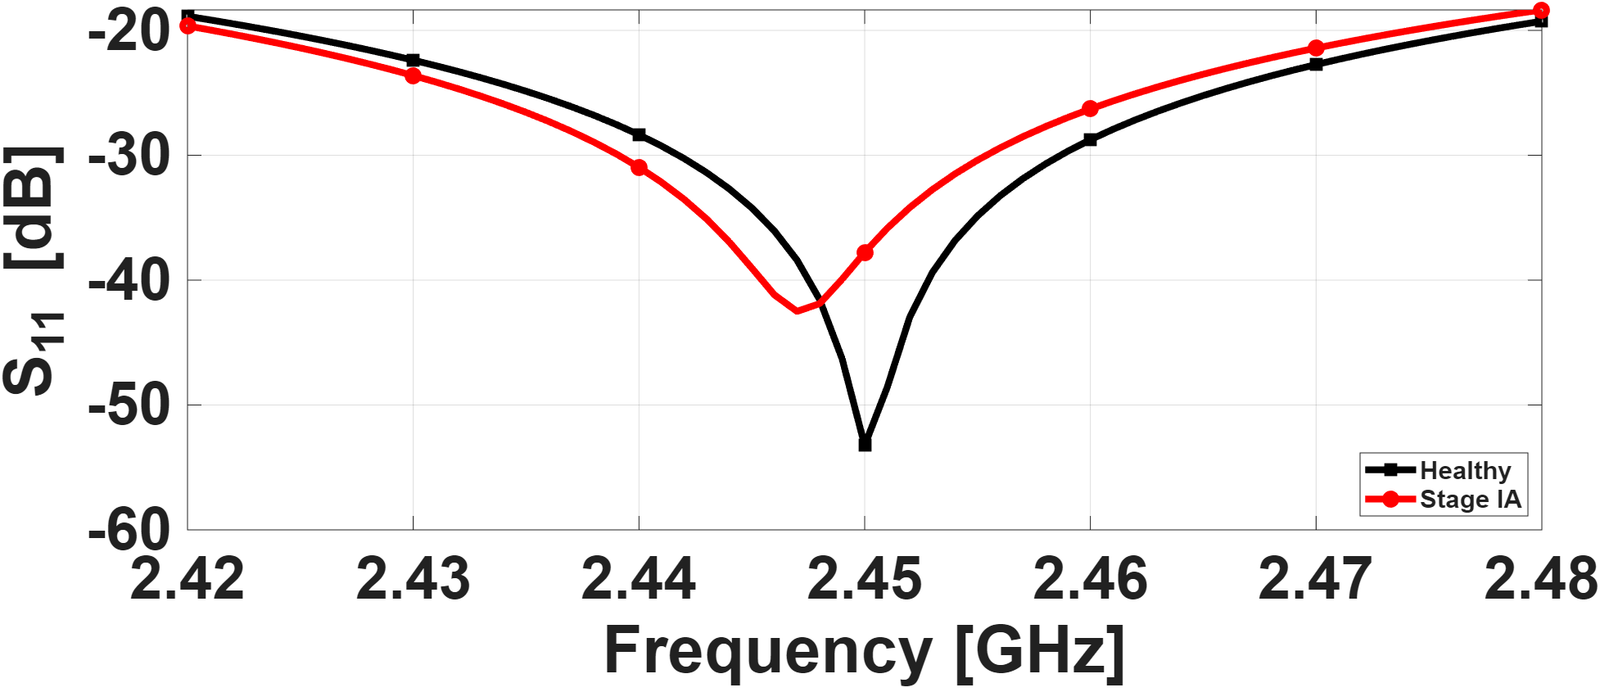
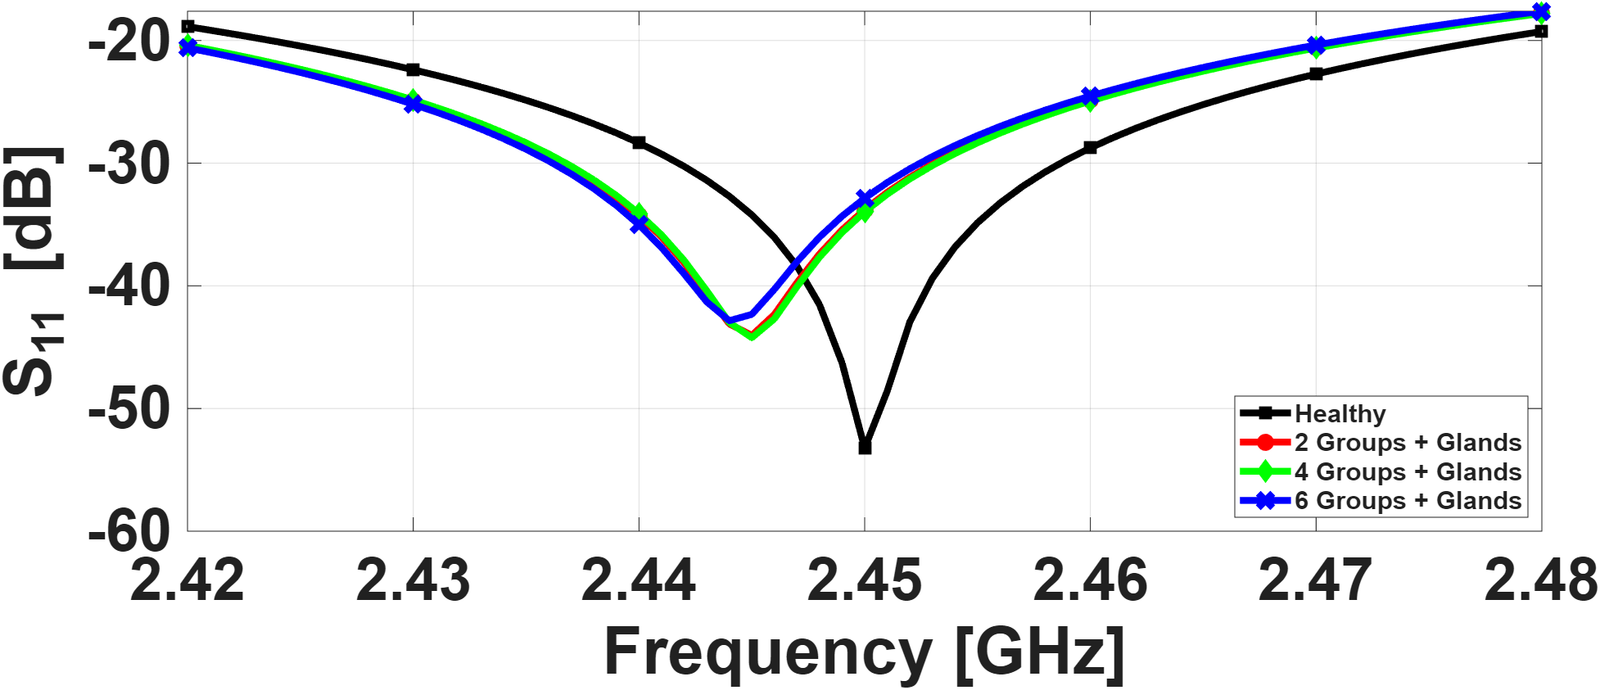
The fabricated antenna confirms a clear resonance in measurement. In the breast model, the healthy case resonates at 2.4500 GHz. Introducing the Stage IA tumor moves the resonance to 2.4470 GHz—a 3 MHz downward shift. Stage IB scenarios also remain below the healthy resonance, with shifts that depend on the number and location of tumors.
2.4500 GHzHealthy reference2.4470 GHzStage IA3 MHzStage IA shift2–10 MHzStage IB shifts reported across tested scenarios
08
SAFETY / SAR
Field absorption was quantified.
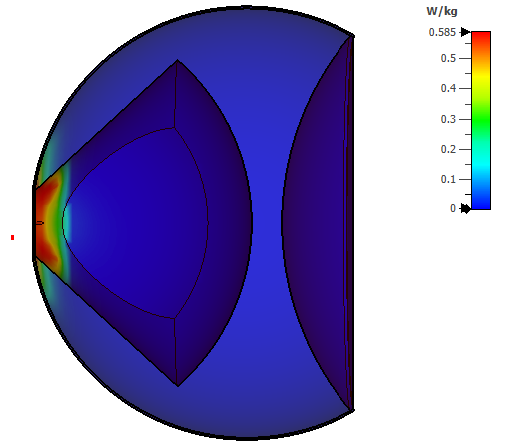
With the antenna implanted on the breast model, SAR was evaluated at 2.45 GHz and averaged over 10 g of tissue. The reported absolute maximum is 0.585 W/kg, concentrated near the antenna placement.
SAR · front viewSAR · cross-sectional view
0.585W/kg MAX 10g SAR @ 2.45 GHz
09
ACTUAL PROJECT WORKFLOW
No mesh pipeline. This is the real workflow.
01
Electromagnetic Design
Design the rectangular spiral sensor and tune it for the 2.4–2.5 GHz ISM band.
→02
CST Breast Phantom
Build the hemispherical tissue model, assign dielectric properties, lymph nodes, ducts and tumor scenarios.
→03
MATLAB Analysis
Process and compare response data, inspect resonance movement, and prepare quantitative result visualizations.
→04
Fabrication + VNA
Fabricate the sensor and measure S11 experimentally to validate the physical antenna response.
10
DMIP 2025 · TOKYO, JAPAN
From the lab to the conference room.
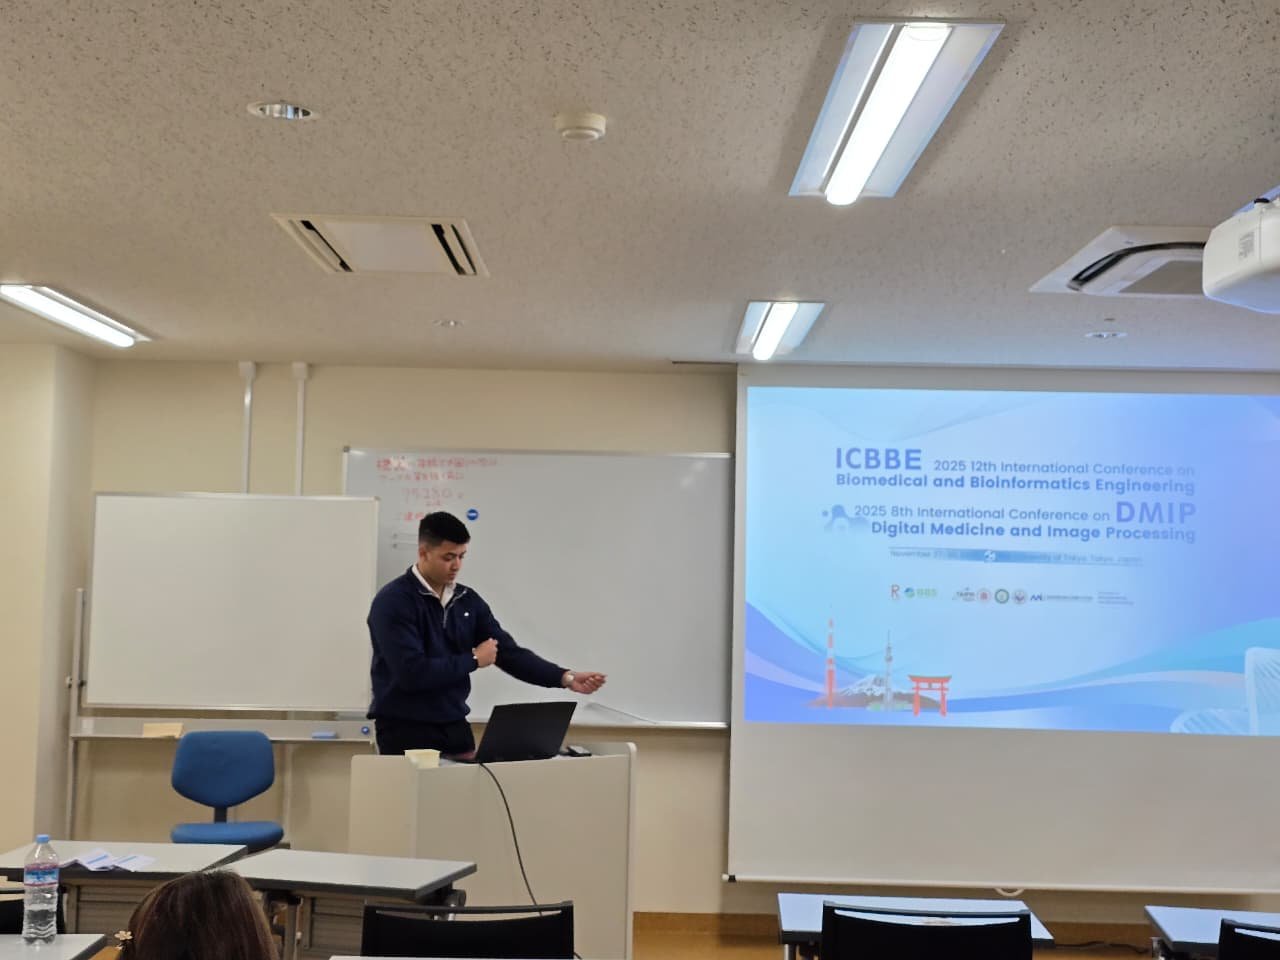
The work was presented at the 2025 8th International Conference on Digital Medicine and Image Processing (DMIP '25) in Tokyo. The presentation brought the antenna design, phantom methodology, tumor scenarios and measured/simulated electromagnetic response into a single research story.
Authors: Ismaeel M. Awad · Aya M. Hakik · Mohamad H. M. Hassanin · Pierre Louka · Mazen Nabil Desouky · Prof. Dr. A. M. M. A. Allam
Presenting “Electromagnetic Diagnosis of First Stage Breast Cancer”DMIP 2025 / ICBBE conference session · Tokyo
RESEARCH DOCUMENTS
Read the full work.
The complete research paper and its GUC undergraduate-research cover page are available directly from this portfolio.
A research journey spanning electromagnetic modeling, antenna engineering, physical fabrication, VNA measurement, MATLAB analysis and international presentation.
Build a realistic electromagnetic simulation framework for studying how malignant tissue changes the microwave response of an anatomically representative head model.
This is not a pasted image. The model below is rendered as live HTML/CSS layers. Click any tissue to isolate it, inspect its role, and visually separate it from the neighboring tissues.
INTERACTIVE PHANTOM // CST MODEL ARCHITECTURE10 TISSUE LAYERS
ANTENNA
ROTATE MODEL
SCALP
FAT
PERIOSTEUM
SKULL
DURA
ARACHNOID
CSF
PIA
GRAY MATTER
WHITE MATTER
SELECTED TISSUE
ALL LAYERS
Explore the complete scalp-to-white-matter stack. Select a layer to isolate it and inspect how it fits into the electromagnetic head phantom.
MODEL ORDER01 → 10SIMULATION ROLEMULTILAYER PHANTOMKNOWN PROJECT VALUESELECT A LAYER
03
ANATOMICAL MODEL WORKFLOW
From Medical Data to CST.
01BrainWebSource anatomical MRI data used for gray- and white-matter geometry.
→
023D SlicerExtract, segment, scale and export the required brain structures.
→
03MeshLabClean the mesh, reduce complexity and prepare simulation-ready STL geometry.
→
04CSTImport, align, assign tissue materials, integrate the antenna and run full-wave simulation.
GEOMETRY
GM + WM Placement
Gray matter and white matter are aligned inside the pia and checked through X/Y/Z section views before simulation.
VALIDATION
Containment Checks
Imported anatomical structures are scaled and positioned so each inner structure remains fully contained by the surrounding model.
COMPLEXITY
Mesh Preparation
High-density anatomical surfaces are cleaned and reduced before CST import to keep the model practical for electromagnetic simulation.
MODEL PARAMETERS
Geometrical & Electrical Properties.
Known values below come from the current project model. Unknown or still-changing values are intentionally not invented.
Layer
Known Radius
εr
σ (S/m)
Model Role
Scalp
90 mm
—
—
Outermost tissue
Fat
88 mm
—
—
Subcutaneous layer
Periosteum
85.5 mm
—
—
Skull interface
Skull
85 mm
—
—
Bony layer
Dura
—
—
—
Meningeal layer
Arachnoid
—
45
1.9
Meningeal layer
CSF
—
—
—
Fluid layer
Pia
75.45 mm
45
1.7
Inner meningeal layer
Gray Matter
Anatomical STL
—
—
BrainWeb geometry
White Matter
~71.4 mm reference
—
—
Inner anatomical STL
DESIGNUWB Patch Antenna
Patch radiator with narrow feedline, bent to conform to the head surface.
PLACEMENTDirect Contact
No intentional air gap between antenna and head model.
FEEDDiscrete / Coaxial Investigation
The project evolved through discrete-port and coaxial-feed configurations.
KNOWN COAX VALUEr_coax_in = 0.5
Inner coaxial radius value recorded in the current project configuration.
PURPOSEMalignant Target
Introduced into the brain model to investigate tumor-induced electromagnetic response variations.
COMPARISONWith vs Without Tumor
The portfolio uses your real CST S11 plots for the scientific comparison.
LOCATION / SIZEProject-dependent
No value is fabricated here. Add the final tumor radius and coordinates once fixed.
SOLVERTime Domain
Used after the frequency-domain workflow became computationally problematic for the full head model.
OUTPUTS11 + EM Fields
Reflection response and electromagnetic field behavior are key outputs of the investigation.
POSITIONINGφ / θ Reference
Spherical-coordinate references are used to track controlled antenna locations around the head.
04
ANTENNA DESIGN & INTEGRATION
UWB Patch Antenna Conformal to the Head.
The visual schematic follows the project's patch-and-feedline form and the bent placement used to maintain direct contact with the head surface.
✓ Patch radiator✓ Narrow feedline✓ Bent / conformal placement✓ Direct contact — no air gap
→
PLANAR DESIGNCONFORMAL INTEGRATION
05
POSITIONING
Controlled Antenna Placement.
Position is represented with spherical coordinates so controlled shifts around the head can be studied without changing the antenna design.
X
Y
Z
φ
θ
06
SIMULATION METHODOLOGY
From Antenna Excitation to Tumor Response.
The investigation is built around controlled comparison. The antenna is integrated directly with the head model, the electromagnetic response is simulated, and the resulting S-parameters can be compared between model conditions.
01
Excitation
Feed the antenna and establish the electromagnetic excitation used for the head-model investigation.
02
Head Interaction
Observe how the radiated field interacts with the multilayer tissues rather than treating the head as a homogeneous object.
03
Target Variation
Introduce the tumor target inside the modeled brain region while preserving the surrounding geometry and antenna configuration.
04
S-Parameter Study
Use the real CST S11 response to inspect changes in antenna behavior associated with the simulated model condition.
07
SIMULATION & RESULTS
Your Real S11. No Fake Results.
The scientific result panels below are populated only from the S11 screenshots you upload in WordPress. The plugin does not invent measured or simulated curves.
UPLOAD S11 WITH TUMOR
S11 — With Tumor
UPLOAD S11 WITHOUT TUMOR
S11 — Without Tumor
UPLOAD COMPARISON PLOT
S11 — Comparison
REAL PROJECT DATA
S11 plots are intentionally user-supplied so the portfolio always shows the actual CST results from the research.
PUBLISHED RESEARCH · BIOMEDICAL ELECTROMAGNETICS · DMIP 2025
ELECTROMAGNETIC DIAGNOSIS OF FIRST STAGE BREAST CANCER
A compact rectangular spiral antenna was designed, fabricated and investigated as an electromagnetic sensor for early-stage breast-cancer diagnosis. The study tracks how malignant tissue changes the antenna's resonant response when the sensor is placed directly on a multilayer breast phantom.
ISM 2.4–2.5 GHzCST MICROWAVE STUDIOMATLAB ANALYSISVNA VALIDATIONS11 / RESONANCE SHIFT
REAL RESEARCH MODELHemisphere radius 75 mm · antenna mounted in direct contact
2.45GHz HEALTHY RESONANCE
3MHz STAGE IA SHIFT
0.585W/kg MAX 10g SAR
6TISSUE / TARGET MATERIALS
01
THE RESEARCH QUESTION
Can an antenna feel the difference?
Healthy and malignant breast tissues do not interact with electromagnetic fields in the same way. Their different dielectric properties alter the electromagnetic loading seen by an antenna placed on the breast. This work uses that change as the sensing mechanism: keep the antenna and phantom configuration controlled, introduce early-stage tumor scenarios, and observe the shift in resonance and impedance matching.
The goal is not to create an anatomical image from MRI data. There is no BrainWeb, 3D Slicer or MeshLab workflow here. The breast phantom is a purpose-built electromagnetic model, simulated in CST; MATLAB is used in the analysis workflow, and the fabricated antenna is validated experimentally with a Rohde & Schwarz ZVB20 Vector Network Analyzer.
SENSORPrinted rectangular spiral antennaDIAGNOSTIC FEATUREResonance-frequency shiftREFERENCEHealthy breast response
The phantom is a simplified hemispherical breast with a 75 mm radius. It includes skin, fat and muscle as the principal layers, while fibro-glandular tissue and lymph nodes are embedded inside the fat region. Three lymph nodes are modeled on each side of the fibro-glandular region, with ducts also represented. A flattened area at the nipple provides a repeatable mounting surface for the antenna.
This geometry allows the same sensor position to be maintained while tumor size and location are varied—so the resulting S11 changes can be compared against a healthy baseline.
LIVE MODEL VIEWElectromagnetic sensing concept
ALL TISSUESSelect a tissue above or click it directly on the model.
Fibro-glandularLymph nodesTumorSpiral sensor
Cross-sectional phantom architectureIsometric phantom with mounted antennaFront view and symmetric lymph-node placement
03
MATERIAL MODEL
Six electromagnetic material definitions.
The model explicitly separates tissue types by relative permittivity, conductivity and density. That contrast is fundamental to the sensing principle.
Tissue
εr
σ (S/m)
ρ (kg/m³)
Skin
37.9735
1.478
1100
Fat
5.14085
0.139
920
Fibro-glandular
57.2
1.99
1050
Muscle
52.668
1.773
1060
Lymph node
78
0.965
1050
Tumor
46.1
0.68
1050
04
FIRST-STAGE SCENARIOS
Stage IA to Stage IB: location matters.
Stage IA is represented by a single tumor in the fibro-glandular region. Stage IB extends the investigation to lymph-node involvement: 2, 4 and 6 lymph-node groups are tested, both with and without an additional fibro-glandular tumor. Each scenario is compared to the same healthy breast response.
Stage IA · cross-sectional viewStage IA · 3D modelStage IB · lymph-node groupsStage IB · groups with fibro-glandular tumor
05
FROM SIMULATION TO HARDWARE
Designed. Fabricated. Measured.
The sensor is not only a simulation. The rectangular spiral antenna was physically fabricated and characterized using a Rohde & Schwarz ZVB20 Vector Network Analyzer. The antenna uses annealed copper on Rogers 4350B, with a matching superstrate for protection and stability, and a 50 Ω coaxial feed.
The design targets the 2.4–2.5 GHz ISM band. Measurement provides a reality check against the simulated antenna response before the sensor is used as the diagnostic element in the breast-phantom study.
Fabricated spiral sensor in front of the ZVB20 VNAExposed copper spiral geometrySensor with protective superstrateExperimental S11 measurement
06
ANTENNA ENGINEERING
Compact geometry for biomedical sensing.
The planar spiral was selected for compact size and straightforward fabrication. In air, the design is optimized for good impedance matching in the ISM band. When mounted on the breast, the arm length and feed/shorting positions are retuned to compensate for the strong dielectric loading of tissue.
The fabricated antenna confirms a clear resonance in measurement. In the breast model, the healthy case resonates at 2.4500 GHz. Introducing the Stage IA tumor moves the resonance to 2.4470 GHz—a 3 MHz downward shift. Stage IB scenarios also remain below the healthy resonance, with shifts that depend on the number and location of tumors.
2.4500 GHzHealthy reference2.4470 GHzStage IA3 MHzStage IA shift2–10 MHzStage IB shifts reported across tested scenarios
08
SAFETY / SAR
Field absorption was quantified.
With the antenna implanted on the breast model, SAR was evaluated at 2.45 GHz and averaged over 10 g of tissue. The reported absolute maximum is 0.585 W/kg, concentrated near the antenna placement.
SAR · front viewSAR · cross-sectional view
0.585W/kg MAX 10g SAR @ 2.45 GHz
09
ACTUAL PROJECT WORKFLOW
No mesh pipeline. This is the real workflow.
01
Electromagnetic Design
Design the rectangular spiral sensor and tune it for the 2.4–2.5 GHz ISM band.
→02
CST Breast Phantom
Build the hemispherical tissue model, assign dielectric properties, lymph nodes, ducts and tumor scenarios.
→03
MATLAB Analysis
Process and compare response data, inspect resonance movement, and prepare quantitative result visualizations.
→04
Fabrication + VNA
Fabricate the sensor and measure S11 experimentally to validate the physical antenna response.
10
DMIP 2025 · TOKYO, JAPAN
From the lab to the conference room.
The work was presented at the 2025 8th International Conference on Digital Medicine and Image Processing (DMIP '25) in Tokyo. The presentation brought the antenna design, phantom methodology, tumor scenarios and measured/simulated electromagnetic response into a single research story.
Authors: Ismaeel M. Awad · Aya M. Hakik · Mohamad H. M. Hassanin · Pierre Louka · Mazen Nabil Desouky · Prof. Dr. A. M. M. A. Allam
Presenting “Electromagnetic Diagnosis of First Stage Breast Cancer”DMIP 2025 / ICBBE conference session · Tokyo
RESEARCH DOCUMENTS
Read the full work.
The complete research paper and its GUC undergraduate-research cover page are available directly from this portfolio.
A research journey spanning electromagnetic modeling, antenna engineering, physical fabrication, VNA measurement, MATLAB analysis and international presentation.